I have setup a Zabbix server in my home, with zabbix clients throughout the network where possible and custom scripts to handle the others.
While Zabbix setup is worthy of numerous posts of its own, as well as my InfluxDB, ELK and Grafana setup, and they are constantly evolving, this post is only about the Raspberry Pi in use to run the wallboard.
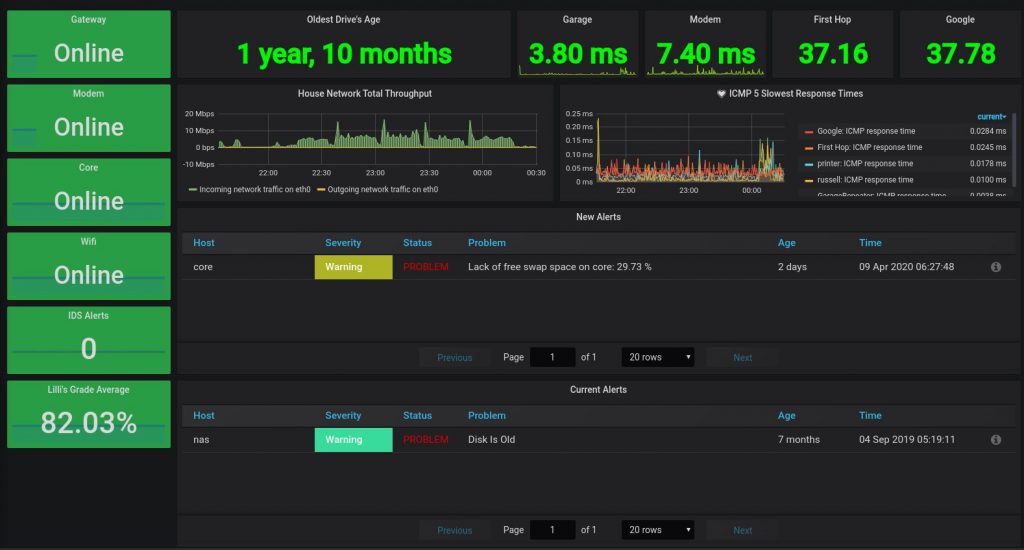
This is what I consider the main screen, showing all the important stuff. I like being able to see the age of the oldest hard drive in the house, so I know what will most likely need replaced first and can swap it before data loss occurs.
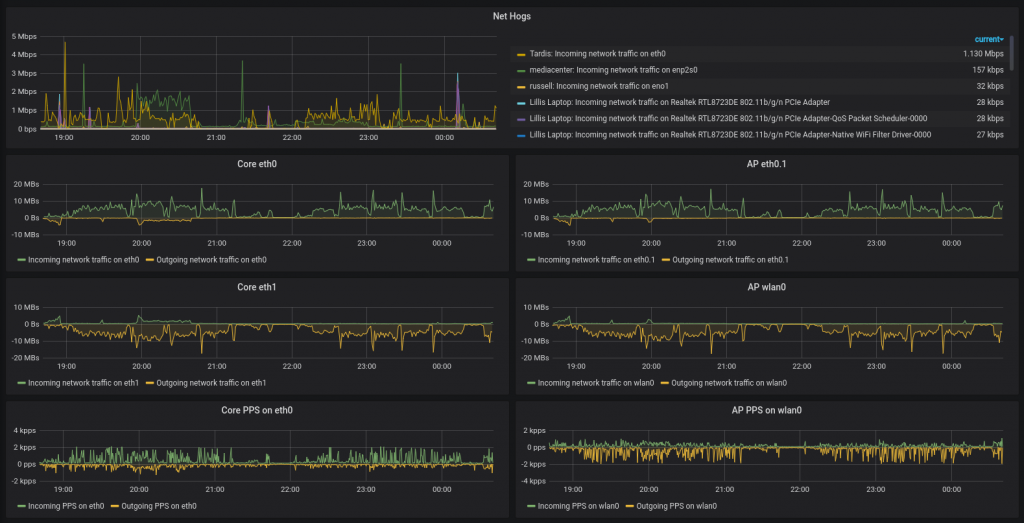
This board shows the main networking activity. The top graph shows who is pulling the most data, the rest shows the overall flows through the various devices.
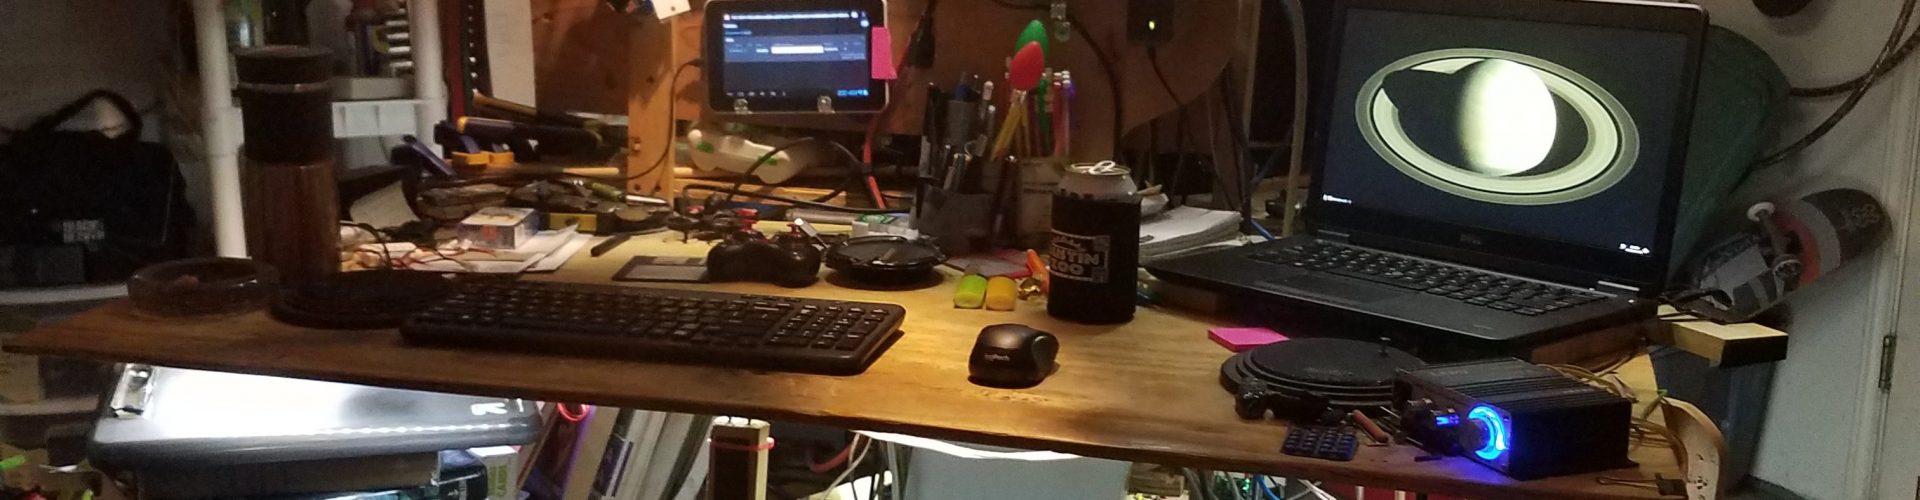
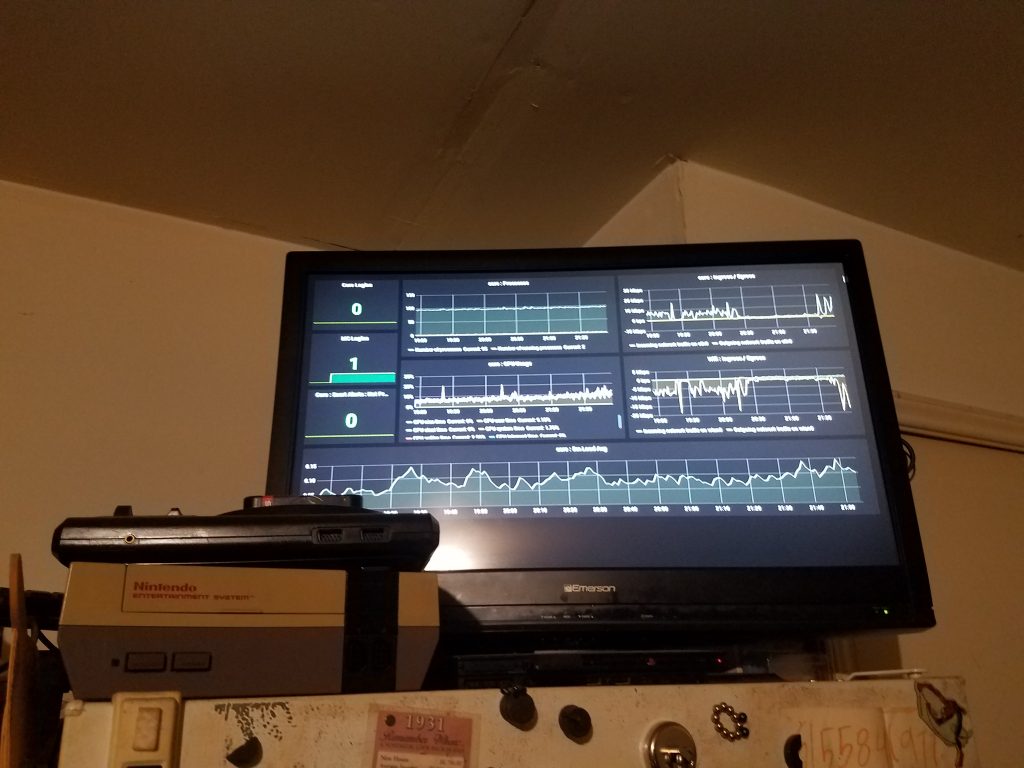
Here is what it looks like as it sits in my cave, always rotating through various screens.
The Raspberry Pi side of things is quite simple due to the setup. I use Grafana to put together these graphs and boards, then I put them together into a playlist that’s set to auto-rotate through them.
Here’s the script that I have set to automatically run when the Pi is powered up:
!/bin/bash
/home/pi/.screenlayout/default.sh
chromium-browser --start-fullscreen --app='http://192.168.5.105:3000/playlists/play/1?kiosk' &
DISPLAY=:0 xdotool mousemove 1365 780
Very short script, but there are three main parts
- Ensure the screen is set correctly (the TV doesn’t like the HDMI defaults – custom xrandr command)
- Launch the web browser fullscreen to the Grafana playlist URL
- Move the mouse to the corner of the screen to hide it